Online Manual
Main Interface
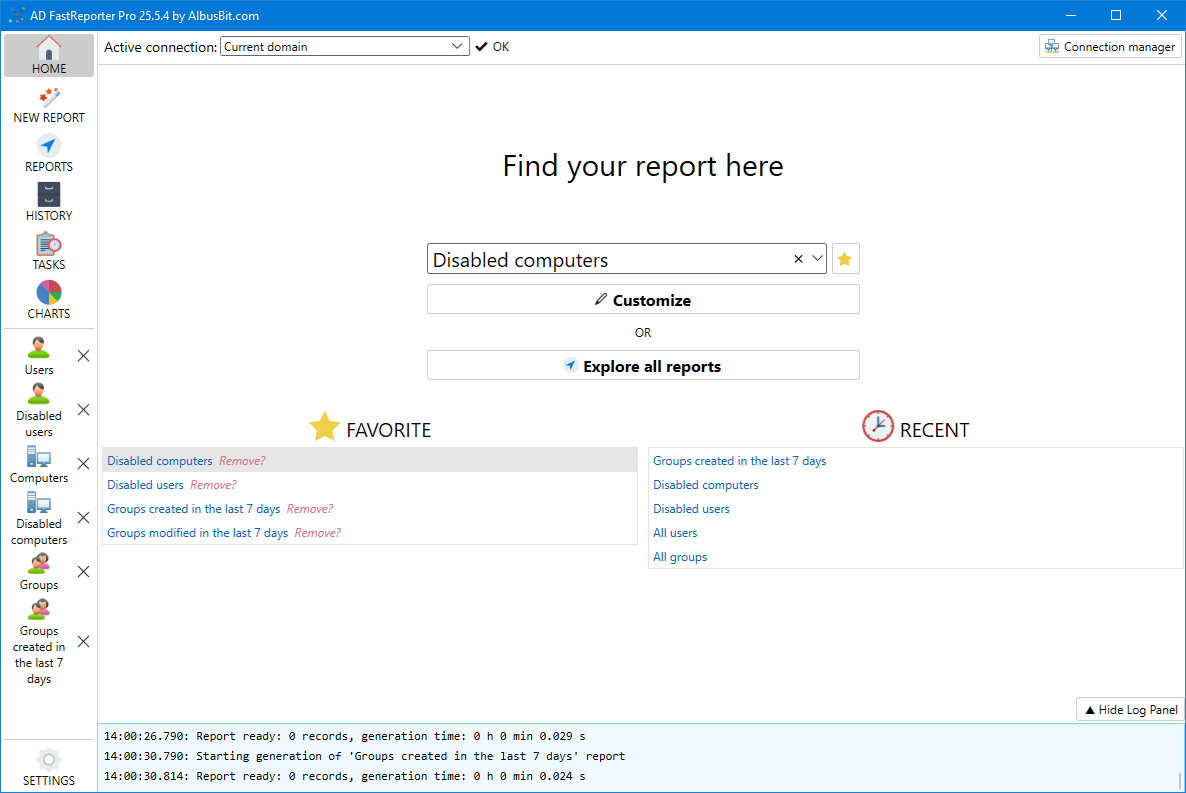
The AD FastReporter interface is organized around a left sidebar for navigation, a top connection bar, a main content area that changes based on what you’re doing, and a bottom log panel for monitoring operations.
Left Sidebar
The sidebar is the primary navigation. It contains these fixed items:
HOME — The starting screen. Shows a search box to find reports by name, a Favorites section for reports you’ve starred, and a Recent section showing the last reports you opened. Click “Explore all reports” to jump into the full report catalog.
NEW REPORT — Opens the report form creation dialog where you can define a new custom report form from scratch. This is a Pro feature — in the Free edition, you work with the built-in report forms.
REPORTS — Opens the report catalog organized by category (Users, Computers, Groups, Exchange, Contacts, Printers, GPOs, OUs). This is where you browse and select report forms to generate. See Report Categories for details on what’s available in each category.
HISTORY — Opens the report history view where you can browse and reload previously generated reports stored in the local database. Pro feature. See Report History.
TASKS — Opens the task manager for creating and managing scheduled automated reports. Pro feature. See Scheduled Tasks.
CHARTS — Opens the charts view for generating visualizations from report data. Pro feature. See Charts.
SETTINGS — Opens the settings panel with tabs for Connections, General options, Email/SMTP configuration, Debug logging, and License management. See Settings.
When you open a report form or generate results, a new tab appears in the sidebar below the fixed navigation items. You can have multiple reports open at the same time and switch between them by clicking their tabs. Close a tab by clicking the X button next to the tab name.
Top Connection Bar
The bar at the top of the window shows the currently active AD connection and its status:
- Connection dropdown — Select which connection to use for the next report. All connections configured in Settings → Connections appear here.
- Connection status — Displays “Ok” when connected, “Testing” while verifying, or an error message if the connection fails.
- Connection Manager button — Quick shortcut to open the connection settings without going through the sidebar.
Switching connections in the dropdown takes effect immediately — the next report you generate will use the selected connection.
Main Content Area
This area displays the active view based on your sidebar selection:
- Home view — Search, favorites, and recent reports
- Report catalog — Category tabs at the top, subcategory groups and report forms in a sidebar panel, and the selected report form’s details (fields, description, filters) in the main area
- Report results — Data grid with the generated results, plus toolbar buttons for export, email, and other actions
- Report form editor — Field selection, filter configuration, and report settings when creating or editing a custom report
- Settings panels — Tabs for each settings area
- Charts, Tasks, History — Each with their own dedicated interface
Log Panel
The bottom panel shows application logs — progress messages during report generation, warnings about non-replicated attributes, error messages, and other operational information.
You can toggle the log panel visibility by clicking the “Hide Log Panel” / “Show Log Panel” button. During report generation, the log panel shows real-time progress including the current operation and record count.
For more detailed logging, enable debug mode in Settings → Debug. Debug logs are written to files in the configured log folder (default: %ProgramData%\AlbusBit\ADFastReporter\logs).
Notifications
AD FastReporter shows notifications within the interface for:
- License status — Reminders when your license or trial is approaching expiration, with a link to renew or upgrade
- Update availability — Alerts when a new version of AD FastReporter is available for download
- Pro feature prompts — When you attempt to use a Pro-only feature in the Free edition, a dialog appears explaining what the feature does and offering options to request a trial or purchase